
On April 7, 2026, the United States (US) and Iran announced a temporary two-week ceasefire, following intensive diplomatic mediation led by Pakistan during a critical window of escalation. The conflict had erupted on Feb. 28, 2026, when the US and Israel launched coordinated military strikes targeting Iranian infrastructure. In response, Tehran moved to close the Strait of Hormuz to international commercial shipping, precipitating the most severe energy supply shock in modern market history.
The closure effectively paralysed approximately 20 million barrels per day that would ordinarily transit the Strait of Hormuz in peacetime, accounting for nearly a quarter of global seaborne oil trade. Under the terms of the ceasefire, Iran announced a conditional reopening of the strait, while the parties agreed to commence diplomatic talks in Islamabad on April 10. This analysis examines the full scope of the crisis and evaluates the prevailing oil price scenarios, drawing on lessons from comparable historical shocks to assess the fragility of the current environment and its potential trajectories.
Diagnosing the Crisis — From the Closure of Hormuz to the Negotiation Table
The Strait of Hormuz represents the central artery of the global hydrocarbon economy. At its narrowest point, it spans no more than 34 kilometres, yet in peacetime it accommodates over 135 vessels daily transporting crude oil, refined products, and liquefied natural gas (LNG) to markets across Asia and Europe. At the height of the conflict in March 2026, maritime traffic fell to its lowest levels, as the Islamic Revolutionary Guard Corps (IRGC) conducted no fewer than 21 attacks on commercial vessels, with at least 16 ships sustaining damage.
Although the ceasefire has, in principle, enabled the resumption of navigation, Iran has made this contingent on what it terms “coordination with the Iranian armed forces,” effectively consolidating its control over a tightly managed, opaque transit regime. Satellite imagery and vessel-tracking data point to the emergence of two distinct corridors: a northern route controlled by the IRGC near Larak Island, and a southern route passing through Omani territorial waters via back-channel diplomatic arrangements.
In light of these dynamics, nearly 800 vessels, including 426 crude oil tankers and fuel carriers, remain stranded across the Arabian Gulf and the Gulf of Oman, awaiting firm guarantees for safe passage. The following table outlines the status of vessels in the Strait of Hormuz as of the end of the first week of the ceasefire:

Iran has entered the Islamabad negotiations with a proposal that appears deliberately hard-line in its terms. It calls for formal recognition of Iranian sovereignty over the Strait of Hormuz and the imposition of a $2 million transit fee on every vessel. This levy alone would add approximately $2 per barrel to the cost of Gulf oil, effectively establishing a structural and enduring tax burden on the global economy. On the security front, Tehran is demanding the full withdrawal of US combat forces from their bases in the Middle East, the suspension of operations against its allied groups, and comprehensive compensation for war-related damages.
On the economic front, Iran is demanding the lifting of all sanctions imposed by the US, the United Nations Security Council (UNSC), and the International Atomic Energy Agency, as well as the release of its frozen assets abroad. More critically from a political standpoint, Tehran insists that any final agreement be codified in a binding UNSC resolution, as a safeguard against future unilateral Western withdrawals. By contrast, the US views the ceasefire primarily as a mechanism to restore the flow of commercial maritime navigation. This fundamental divergence in expectations has kept global markets on edge, reacting sharply to each leak emerging from the negotiation rooms.
The Scale of the Supply Shock and the International Response
At the peak of the crisis, between 9 and 11 million barrels per day were effectively prevented from reaching international markets. The underlying data underscore the fragility of regional supply structures. Iraq’s exports collapsed from 4 million barrels per day to just 900,000, reflecting its near-total dependence on the capacity-constrained pipeline route through Turkey. Saudi Arabia suspended approximately 2.5 million barrels per day of its exports, redirecting only limited volumes via the East–West pipeline to the port of Yanbu. The UAE curtailed around 2 million barrels, although it succeeded in exporting 1.5 million barrels per day through the Habshan–Fujairah pipeline, thereby bypassing the Strait of Hormuz. Meanwhile, more than 1.6 million barrels per day of Kuwaiti exports were halted. The figure below illustrates the average daily volumes of disrupted oil flows resulting from the closure of the strait:

These dynamics have collectively produced a structural deficit, forcing a drawdown of commercial inventories and strategic reserves at an estimated rate of 6 million barrels per day. In response to these exceptional conditions, the International Energy Agency coordinated the release of 400 million barrels from member states’ emergency reserves, with the US committing to supply 172 million barrels over a four-month period. However, meeting this commitment would reduce the US Strategic Petroleum Reserve to approximately 243 million barrels, its lowest level since 1982, effectively eroding the global economy’s final buffer against any further supply shock.
A further critical dimension in assessing the impact of the ceasefire is that a political declaration of a halt to hostilities is not, in itself, sufficient to restore tanker traffic. In practice, the resumption of commercial navigation depends on whether maritime insurers can price transit risks at economically viable levels. War-risk insurance premiums for Very Large Crude Carriers, typically valued at around $100 million, have surged to as much as $5 million per single transit, equivalent to 5% of the vessel’s hull value. This figure excludes coverage for the cargo itself and the substantial daily hazard pay demanded by crews operating in active conflict zones.
The immediate consequence of these dynamics is that only tankers backed by sovereign support from countries such as China, India, and Pakistan can absorb such elevated costs, while independent commercial shipowners have largely refrained from assuming these risks. This imbalance is unlikely to reverse unless maritime insurers, particularly those operating in major financial centres such as London, receive credible and binding assurances that freedom of navigation will be upheld and cannot be unilaterally disrupted by Iran. Such guarantees remain absent under the current, fragile ceasefire framework.
Interpreting Historical Precedents of Disrupted Navigation in the Strait
To assess the implications of the current crisis, it is necessary to revisit its closest historical analogue: the “Tanker War” during the Iran–Iraq conflict between 1981 and 1988. However, this comparison remains structurally constrained. At that time disruptions removed only around 2.6% of global supply, whereas the present conflict has constrained nearly 20%, approximately eight times the earlier shock. Moreover, the Organisation of the Petroleum Exporting Countries possessed substantial spare capacity outside the conflict zone, and Western powers undertook concrete measures to secure maritime flows, including the reflagging of Kuwaiti tankers under the US flag.
A closer parallel can be drawn with the shock of the 1990 Gulf War, when the conflict abruptly removed 4.3 million barrels per day from global markets, driving prices sharply higher before a rapid collapse once the Western-led coalition demonstrated overwhelming military superiority. This, in turn, restored market confidence in the eventual return of supply. The central lesson from 1990 is decisive: geopolitical risk premiums dissipate only when markets regain full confidence in the security of physical supply flows. The current ceasefire falls short of providing such assurance. On the contrary, Iran’s retention of its drone arsenal and its insistence on sovereign transit fees indicate that the risk premium will remain resistant to any full erosion.
The Strategic Implications of Integrating the Iridium satellite network into the Guidance Systems of Shahed drones
The figure below outlines the three projected oil price scenarios, which are examined in detail in the following section:

Scenario 1: Collapse of Negotiations and Return to War ($135–$150 per barrel)
This worst-case scenario assumes a breakdown in the Islamabad talks, either due to Iran’s refusal to moderate its demands concerning sovereignty over the Strait of Hormuz, the imposition of transit fees, and the lifting of all sanctions, or because of renewed US strikes. Under these conditions, the strait would likely be fully closed once again, potentially accompanied by the deployment of naval mines, while Iranian drones target anchored oil tankers and energy infrastructure across the Gulf states.
Under this cumulative pressure, projections from major financial institutions converge at deeply concerning levels. JPMorgan warns that Brent crude could surge to $150 per barrel if the closure persists through mid-May, while Goldman Sachs places the upper bound of risk at $135 under a six-month constrained supply scenario. At the macroeconomic level, industrial output across Asia and Europe would be curtailed, inflationary pressures would intensify sharply, and central banks would come under sustained pressure to maintain restrictive monetary policies. This dynamic would significantly increase the likelihood of a global economic downturn, a risk that JPMorgan had already estimated at 35%.
Scenario 2: Prolonged Ceasefire without Settlement ($95–$115 per barrel)
This scenario represents the most plausible extension of current conditions, whereby the ceasefire is repeatedly renewed through protracted negotiations that fail to yield a permanent peace settlement. In this context, Iran maintains a heavy military presence in the Strait of Hormuz and preserves a transit regime under its supervision, keeping maritime insurance premiums elevated at 2% to 5% of hull value. As a result, the bulk of the approximately 20 million barrels per day remains effectively constrained, as independent tanker operators continue to avoid the heightened risks associated with transit.
In this scenario, Brent crude stabilises within a volatile $95-$115 per barrel range. This trajectory aligns with projections from the US Energy Information Administration, which anticipates an average of around $115 in the second quarter of 2026, followed by a gradual easing. Even so, this range remains approximately 50% above pre-war levels of $60 to $70 per barrel, exerting sustained inflationary pressure and constraining the global economy’s recovery.
Scenario 3: Comprehensive Diplomatic Settlement ($70–$80 per barrel)
In this most optimistic scenario, the Islamabad talks produce a binding and verifiable framework under which Iran scales back the militarisation of the Strait of Hormuz and abandons its demand for sovereign transit fees, in exchange for a targeted easing of US sanctions. Once freedom of navigation is verified on the ground, maritime insurance premiums would fall rapidly to pre-war levels, allowing the approximately 800 stranded vessels to resume movement as they move swiftly to clear accumulated cargoes. A critical point must be underscored: financial markets are inherently forward-looking. Accordingly, the unwinding of the geopolitical risk premium would be priced into futures contracts well before actual production normalises, a process that, according to Rystad Energy, may take between one and three months following the signing of an agreement.
Goldman Sachs expects Brent crude to stabilise at around $71 per barrel in the fourth quarter of 2026 and at $80 in 2027. By contrast, Morgan Stanley adopts a more cautious stance, arguing that the repricing of geopolitical risk will establish a structural price floor that precludes a return to the $60 range, on the grounds that markets are unlikely to forget the demonstrated fragility of the global supply system.
In conclusion, this analysis demonstrates that the April 2026 ceasefire does not mark the end of the crisis, but rather a pivotal inflexion point open to multiple trajectories. From a purely economic perspective, it is clear that the restoration of normal oil flows is far more complex than political declarations or the often-reactive behaviour of financial markets might suggest. Logistical, insurance, and engineering constraints impose a realistic timeframe that cannot be compressed. Ultimately, the trajectory of oil prices is determined not by the wording of agreements between negotiators but by the degree of confidence that the Strait of Hormuz is sufficiently secure to sustain the movement of global shipping fleets. Such confidence is not established overnight; it builds incrementally with each successful transit and every incident-free day. Conversely, a single disruption is sufficient to return markets to acute uncertainty.
References
Doyle, Gerry. 2026. “Trump Risks Confidence in US Role as Guardian of Global Shipping.” Insurance Journal. April 6, 2026. https://www.insurancejournal.com/news/international/2026/04/06/864557.htm.
Hariesh Manaadiar. 2026. “Iran Approves Toll on the Strait of Hormuz.. But Does It Have the Right To..??” Shipping and Freight Resource. April 2, 2026. https://www.shippingandfreightresource.com/iran-approves-toll-on-the-strait-of-hormuz-but-does-it-have-the-right-to/.
Morgan, J.P. 2024. “Oil Price Forecast for 2026 | J.P. Morgan Global Research.” Jpmorgan.com. J.P. Morgan. 2024. https://www.jpmorgan.com/insights/global-research/commodities/oil-prices.
“Press Releases.” 2026. Organization of the Petroleum Exporting Countries. 2026. https://www.opec.org/pr-detail/593-1-march-2026.html.
“EIA Updates Its Definitions and Estimates of OPEC Crude Oil Production Capacity – U.S. Energy Information Administration (EIA).” 2026. Eia.gov. 2026. https://www.eia.gov/todayinenergy/detail.php?id=66904.
Morningstar, Inc. 2026. “U.S. Released 1.5 Million Bbls of Crude from SPR Last Week, DOE Data Show — OPIS.” Morningstar, Inc. April 6, 2026. https://www.morningstar.com/news/dow-jones/202604063520/us-released-15-million-bbls-of-crude-from-spr-last-week-doe-data-show-opis.
“US Crude Oil in the Strategic Petroleum Reserve Stocks (Wee….” 2026. Ycharts.com. YCharts. 2026. https://ycharts.com/indicators/us_ending_stocks_of_crude_oil_in_the_strategic_petroleum_reserve.


Related Articles
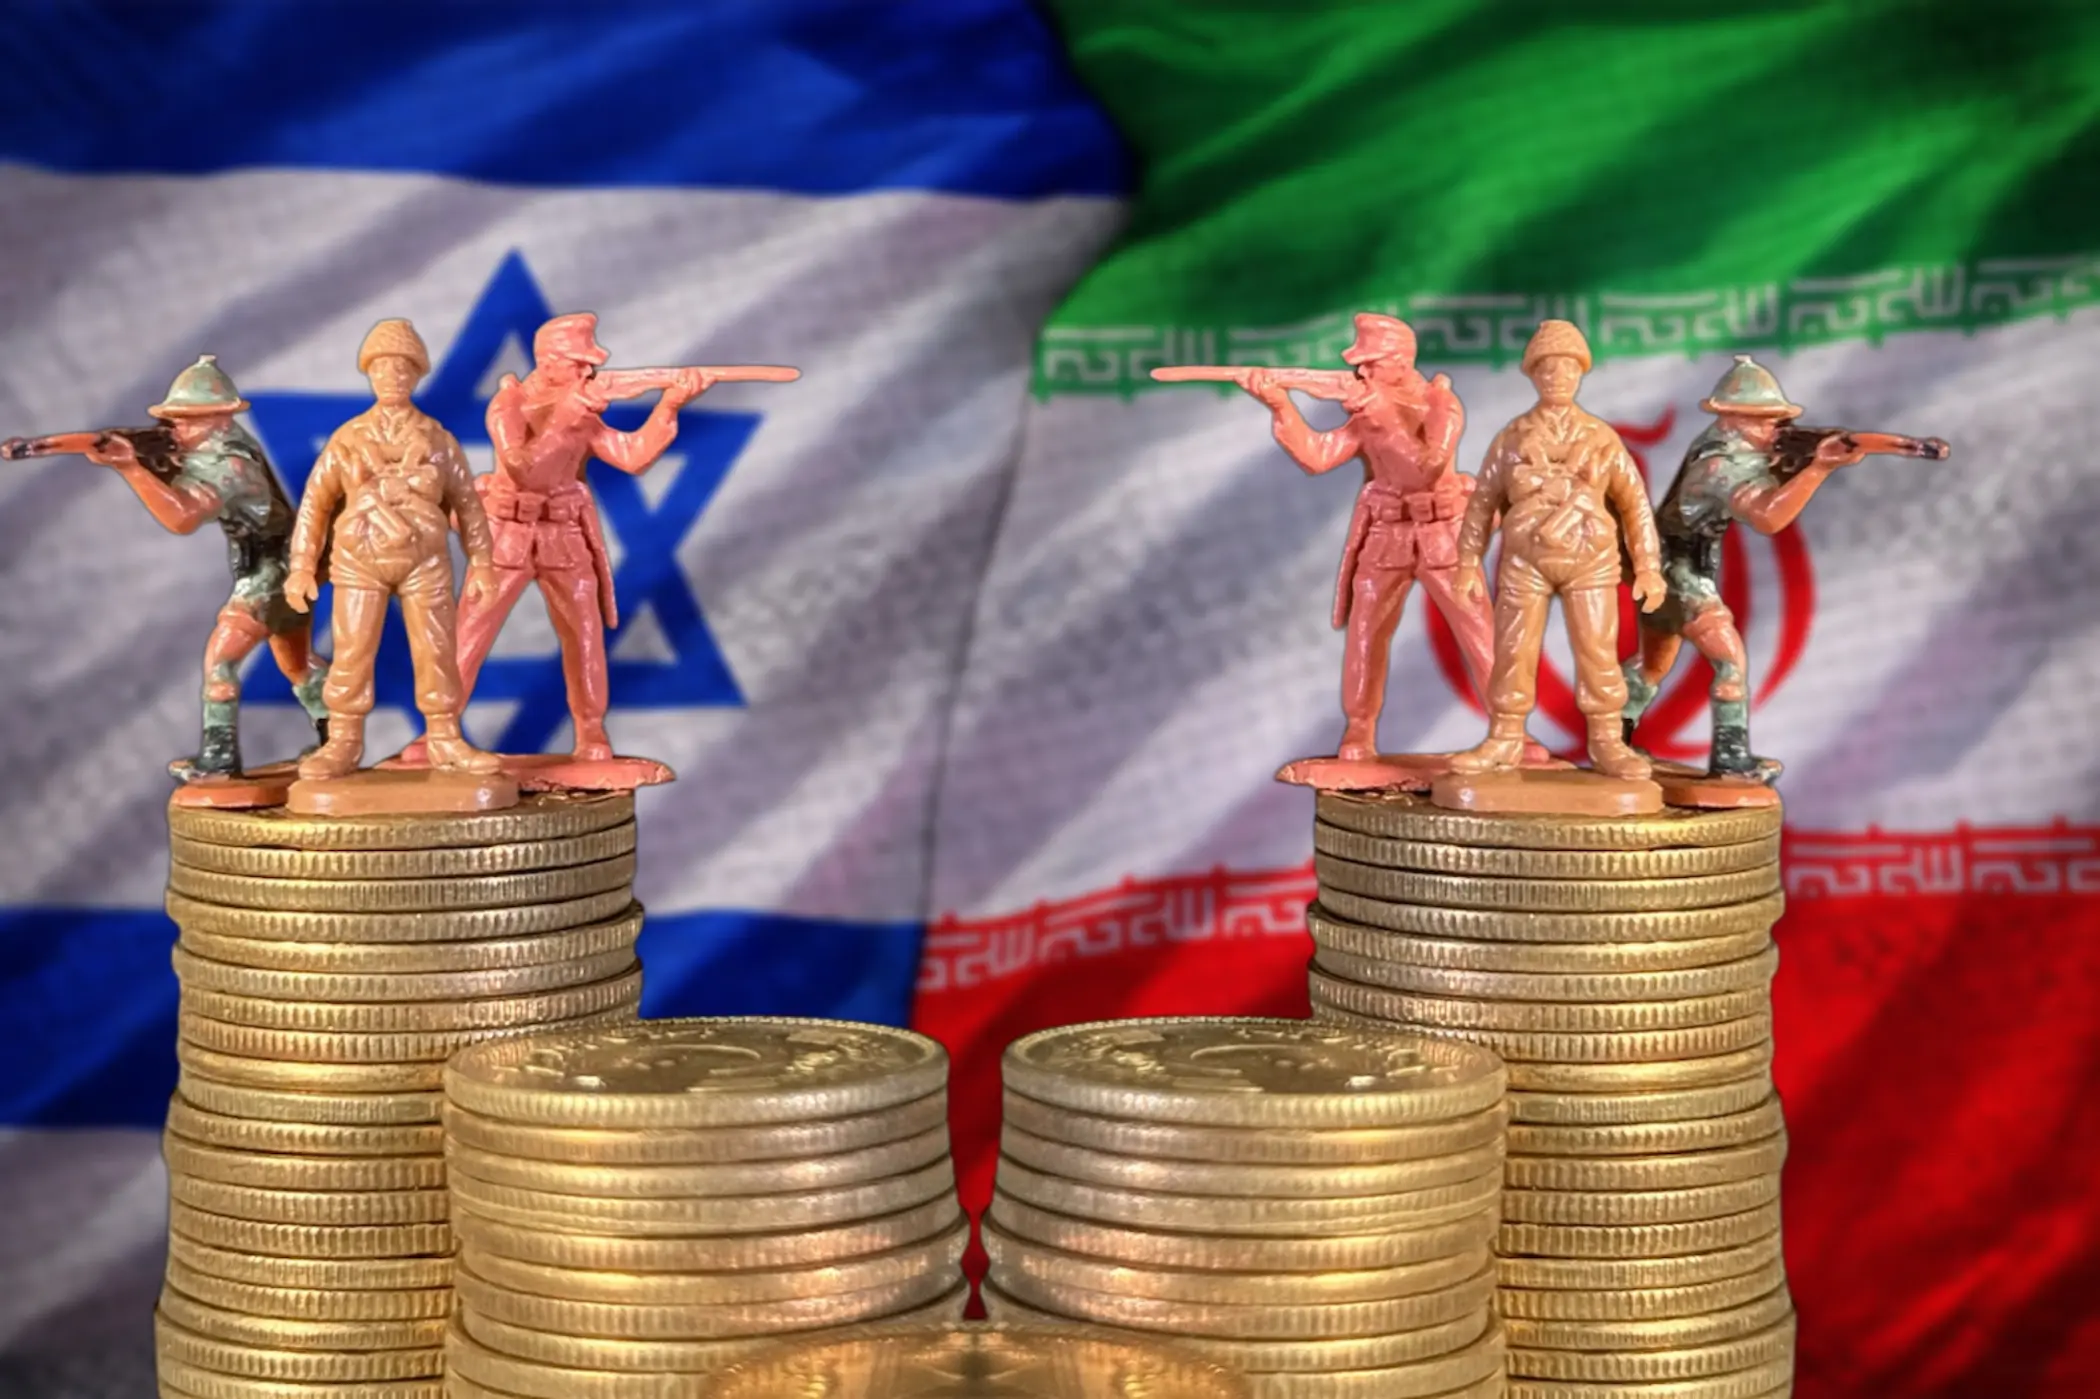
Defence Economies at War: National Budget Stress

Blank Rounds: Can Trump Blockade the Strait of Hormuz?

Breaking the Tether: How Iridium Unleashes Shahed Drones
Pulse: The United States-Israel-Iran War
What If: The United States Launched a Ground Invasion of Iran?

Comments