
The Feb. 28, 2026 United States–Israeli offensive against Iran represents the most consequential escalation in Gulf security dynamics in over a decade and introduces immediate, medium-term, and long-term risks to global energy stability. The strikes targeting senior leadership and strategic military infrastructure triggered Iranian retaliation across the Gulf region and sharply increased the probability of disruption to maritime energy flows, particularly through the Strait of Hormuz.
While physical supply outages remain limited at the time of writing, markets have responded by repricing geopolitical risk. Crude benchmarks surged on reopening, freight and insurance costs rose materially, and volatility spiked across commodities and currency markets. The core economic question is not whether prices react, they already have, but whether the conflict transitions from a risk-premium shock to a sustained supply disruption.
The Strait of Hormuz remains the central transmission channel. Roughly one-fifth of globally traded oil and more than one-third of seaborne liquefied natural gas pass through this chokepoint. Even temporary interference has outsized macroeconomic implications. Assessing the implications of the crisis requires examining immediate market reactions, potential disruption scenarios, medium-term supply responses, and the longer-term structural consequences for global energy security and macroeconomic stability.
Strategic Context: Escalation and Energy Market Sensitivity
It was launched by the U.S. and Israel on Feb. 28, 2026, their most significant joint offensive against Iran, striking leadership targets in Tehran and targeting nuclear and military infrastructure. The strikes resulted in the death of Supreme Leader Ali Khamenei and prompted an immediate and wide-ranging Iranian retaliatory campaign. Iran launched missile and drone salvos against U.S. military installations in the region, as well as sustained barrages directed at Israel.
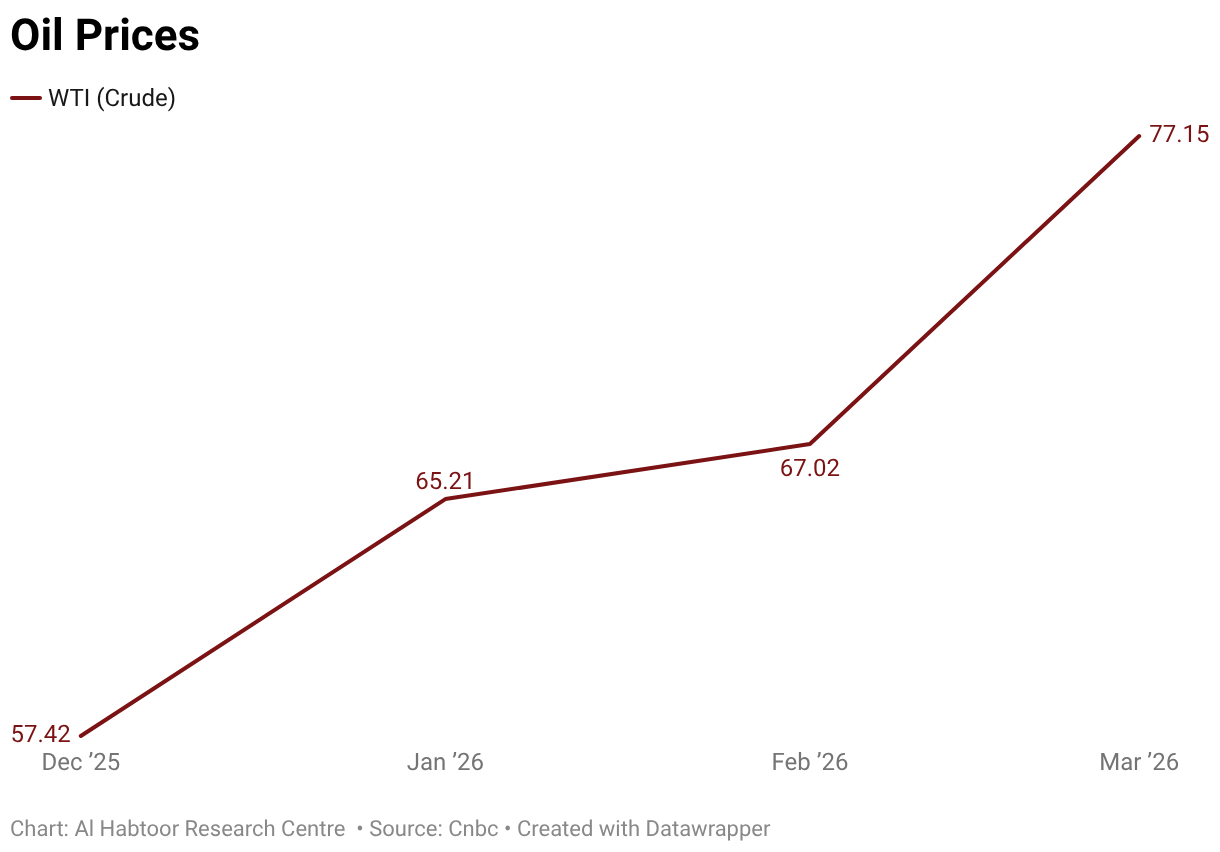
Energy markets reacted with immediate and pronounced sensitivity. The Middle East has historically functioned as a geopolitical tripwire for global commodity prices: the region accounts for approximately one-third of the world’s crude oil production and hosts the Strait of Hormuz, through which a fifth of all globally traded oil passes on a daily basis. Any credible signal of conflict escalation, regardless of whether actual supply flows are immediately disrupted which triggers a risk premium response in futures markets that can move prices by several dollars per barrel within hours. This dynamic was clearly visible when Brent crude settled at $72.48 per barrel on Friday, Feb. 28, its highest close since mid-2025, before opening sharply higher when futures trading resumed Sunday evening and it reached to $79.11 per barrel on Thursday, March 5.
Immediate Market Reaction: Risk Premiums and Price Volatility
Oil markets reacted immediately to the Feb. 28 escalation, repricing geopolitical risk as futures trading reopened on March 1. West Texas Intermediate (WTI) rose approximately 8% from its previous close of $67.02 per barrel to around $72. Then it reached 75 Thursday, March 5. While Brent crude surged toward $80 which is the sharpest single-session move since the early phase of the Russia–Ukraine War in 2022. Notably, Brent had already risen roughly 20% since early June 2025 amid deteriorating Israel–Iran tensions, indicating that part of the risk premium had been incorporated before the strikes.
The immediate price spike reflected both genuine supply-disruption concerns and speculative positioning. Confirmed attacks on vessels transiting the Strait of Hormuz amplified fears of maritime interference. Shipping activity temporarily stalled, with tankers anchoring near the waterway as insurers reassessed war-risk coverage. Freight and insurance costs in the Gulf and Red Sea had already risen by roughly 30% in preceding months, underscoring how transport risk compounds physical supply exposure.
From a market-structure perspective, the shock was concentrated in the prompt segment of the forward curve, with near-term contracts rising more sharply than deferred months, a classic signal of supply-risk pricing rather than demand acceleration. Safe-haven assets responded in parallel: gold extended gains, the Swiss Franc and Japanese Yen firmed, and equity markets shifted toward risk-off positioning.
However, markets have increasingly demonstrated resilience to geopolitical shocks absent sustained physical disruption. As in previous crises, the durability of the price spike will depend less on the initial escalation and more on whether maritime flows through Hormuz remain functionally operational.
The Strait of Hormuz Factor: Supply Shock Scenarios
The Strait of Hormuz is the most consequential oil chokepoint in the global energy system, linking major Gulf producers, including Saudi Arabia, Iran, Iraq, and the United Arab Emirates to the Gulf of Oman and the Arabian Sea. According to Rystad Energy, roughly 15 million barrels per day of crude transit the Strait, representing about 20% of globally traded oil. S&P Global Commodities at Sea estimates that, as of early 2026, around 15 million barrels per day of crude and 5.5 million barrels per day of refined products were flowing through the waterway. In addition, approximately 35% of seaborne LNG exports pass through Hormuz, making gas markets and European energy security particularly vulnerable to disruption.
It is warned that sustained escalation between Iran, the U.S., and Israel could trigger worst-case oil market outcomes, including a major interruption of the energy flows. Such risks may be mitigated only if the U.S. can secure tanker traffic and neutralize potential Iranian naval threats. It was reported that vessels received radio warnings from Iran’s Revolutionary Guards stating that “no ship is allowed to pass the Strait of Hormuz,” underscoring the fragility of this critical maritime corridor.
With Hormuz effectively destabilised, the key determinant for global markets shifts from probability of disruption to duration, each time horizon producing markedly different economic and geopolitical outcomes.

Baseline Scenario — Active Blockade (Current Reality):
The Strait of Hormuz is now effectively closed. Major international shipping lines, including Maersk, have officially suspended transit. Iranian Revolutionary Guard forces have issued formal warnings prohibiting navigation, and tanker traffic has halted on both approaches. This is no longer a risk scenario, it is the operating reality as of March 2, 2026. All subsequent price projections and market assessments must be anchored to this baseline. Brent crude has breached $90 per barrel, war-risk insurance on Gulf-transiting vessels has become prohibitively expensive for most commercial operators, and alternative routing via the Cape of Good Hope is adding 10–14 days to delivery timelines for Asian-bound cargoes.
Duration Scenario 1 — Short-Closure (Days to Two Weeks): Price Spike, Rapid Normalization
If the blockade is resolved within days to two weeks through U.S. naval enforcement, direct diplomatic de-escalation, or a ceasefire agreement, markets are likely to experience a sharp but transient price spike followed by rapid normalization. Brent crude would remain elevated in the $90–$100 range during the disruption period but would retrace significantly once flows resume. Floating storage inventories built up during the closure would suppress prices on the way down. In this duration, demand destruction remains limited, central banks would not need to alter their rate paths, and macroeconomic damage would be contained primarily to elevated input costs and temporary shipping disruptions.
Duration Scenario 2 — Extended Closure (Two Weeks to Three Months): Structural Market Disruption
However, a closure lasting two weeks to three months represents the most analytically consequential scenario for oil market modelling. At this duration, the initial floating storage buffer is exhausted, physical inventory drawdowns become acute, and the structural capacity of alternative routing, the Saudi East-West Pipeline and the UAE’s Fujairah terminal is tested to its ceiling. Combined throughput capacity on these routes is approximately 7–8 million barrels per day, against the 15 million barrels per day that normally transit Hormuz; the deficit cannot be bridged. Brent crude would be expected to sustain levels above $100–$110 per barrel throughout this window. Demand destruction would begin to materialise in price-sensitive emerging market consumers. Inflationary pressure would force central banks in oil-importing economies to delay or reverse easing cycles. The global recession risk, previously modelled as a tail event, becomes a base-case outcome in this duration band.
Duration Scenario 3 — Prolonged Closure (Beyond Three Months): Permanent Market Restructuring
A blockade extending beyond three months would constitute a structural rather than cyclical shock to global energy markets. At this horizon, price signals begin driving supply responses so accelerated U.S. shale drilling programmes, emergency LNG infrastructure permitting, and sovereign energy stockpile drawdowns. Nevertheless, these responses lag the disruption by three to six months. In the interim, sustained prices above $110 per barrel would generate lasting demand destruction in emerging markets, accelerate energy transition investment decisions in major economies, and fundamentally reorder trade relationships as Asian importers permanently diversify away from Gulf-origin supply. The geopolitical risk premium embedded in Gulf crude would likely never fully normalise to pre-conflict levels. Beyond Hormuz, the compounding risk in this scenario is direct Iranian targeting of Gulf oil infrastructure, particularly Saudi Arabia’s Abqaiq complex where equipment replacement timelines are measured in years, not months.
Medium-Term Energy Market Adjustments
OPEC+’s response to the crisis has shaped the medium-term supply outlook. On March 1, 2026, the alliance’s eight core members held an emergency meeting and agreed to raise output by 206,000 barrels per day from April above the 137,000-bpd baseline increment but well below the 548,000-bpd ceiling reportedly under discussion. The move ended a three-month pause in production hikes and marked a partial restoration of the 3.85 million bpd in voluntary cuts introduced since 2023.
Analysts were sceptical of the decision’s immediate market impact, arguing that oil prices would be driven more by shipping flows through the Gulf than by a relatively modest supply increment. Helima Croft of RBC Capital Markets emphasised that effective spare capacity is largely concentrated in Saudi Arabia and the UAE, even though OPEC+ collectively holds roughly 3.5 million bpd in aggregate. Export constraints, particularly if Hormuz navigation remains impaired, limit how much additional crude can actually reach markets.
Ahead of the escalation, Saudi Arabia reportedly raised production by roughly 500,000 bpd, while Iran accelerated exports in mid-February, bolstering near-term inventories. Adding to that, U.S. shale remains a structural buffer but operates with a 3–6 month lag due to drilling timelines, meaning it cannot offset immediate disruptions. Meanwhile, the U.S. administration signalled no immediate release from the Strategic Petroleum Reserve.
Long-Term Structural Implications for Oil Markets
Three structural dynamics will shape how oil markets evolve beyond the immediate crisis. The first one, is the re-embedding of a durable geopolitical risk premium. The previous 18 months had seen successive Middle East escalations absorbed without sustained price disruption, a pattern that had led some market participants to structurally underprice Gulf-origin risk. The current conflict is qualitatively different in scale and in the regime-transition uncertainty it has introduced. Even after the immediate military situation stabilises, a persistent $5–10 per barrel premium on Gulf barrels is a plausible baseline, with compounding effects on global energy inflation over time.
The second dynamic is upstream investment hesitation. Prolonged instability discourages capital expenditure across regional upstream projects. Gulf National Oil Companies and international operators with exposure to Iraqi, Qatari, and Iranian assets face a materially more uncertain operating environment. If conflict duration extends into months, project sanctioning timelines will lengthen, insurance costs for new commitments will rise, and the medium-term supply outlook for the region will deteriorate independently of any direct infrastructure damage. This effect is slow-moving but cumulative, and its consequences for global supply adequacy could become visible within two to three years.
The third is an accelerated reorientation of energy security strategy among major Asian importers. China receives approximately half its crude imports via Hormuz; India and South Korea face comparable exposure. The crisis materially strengthens Russia’s competitive position in Asian crude markets, with both Beijing and New Delhi facing strong incentives to deepen reliance on Russian supply given proximity and established logistics infrastructure. Over the longer term, it reinforces the strategic and economic case for domestic energy capacity investment, reserve expansion, and renewable development among import-dependent economies, not as abstract policy objectives, but as urgent national security imperatives with visible, quantifiable downside risk.
Global Macroeconomic Spillovers
The oil price shock propagates through the global economy via several interconnected channels, with differentiated effects across country groupings. Capital Economics estimates that a sustained rise to $100 per barrel would add 0.6–0.7 percentage points to global inflation, figures that appear contained in isolation but arrive after nearly five consecutive years of above-target U.S. inflation and persistent structural resistance in core services. Dallas Fed scenario modelling reinforces this concern, finding that a full Strait of Hormuz closure driving WTI to $100/bbl would push annualised U.S. headline inflation 1.3 percentage points above the no-conflict baseline in December 2025, easing only gradually to 0.8 percentage points by mid-2026 as prices stabilised.
This inflationary backdrop directly complicates the monetary policy trajectory that both the Federal Reserve and ECB had carefully constructed heading into 2026. Although energy prices are excluded from core PCE, the Fed’s preferred inflation measure, sustained headline pressure risks unanchoring expectations and forcing a slower easing pace. Market pricing already reflects this tension: the probability of an unchanged Fed decision in June 2026 rose to 47% from 42.7% within days of the escalation. The constraint is sharper still for emerging market central banks, many of which were mid-easing-cycle and face greater structural sensitivity to commodity volatility.
For oil-importing developing economies, the consequences extend beyond monetary policy into fiscal and external stability. Widening current account deficits, currency depreciation, and imported inflation converge in contexts where fiscal space for subsidy support is already limited, most acutely in Egypt, Jordan, Pakistan, and across South and Southeast Asia, including India. At the other end of the spectrum, Gulf States receive a headline revenue windfall from higher prices, but this is partially offset by infrastructure damage, airspace disruption, and a chilling effect on investment and diversification agendas. Russia, meanwhile, stands to benefit from the displacement of Gulf barrels in Asian markets as Chinese and Indian buyers seek alternative supply arrangements.
Thus, the current reality is an active blockade of the Strait of Hormuz, with major shipping lines having suspended transit. This is no longer a tail-risk scenario but the established baseline against which market trajectories must be assessed. Prices are therefore expected to remain elevated, with Brent sustained in the $90–$100 range under a short-duration blockade and liable to push well above $110 should the closure extend beyond one to three months. A full maritime blockade is not a low-probability contingency, it is the present condition. Besides, its continued enforcement will materially tighten global financial conditions. The principal uncertainty variable lies in escalation dynamics and regime stability within Iran. For policymakers and investors alike, the current shock should be treated not as an isolated price spike but as a potential inflection point in Gulf risk pricing.
References
Ashitha Shivaprasad. 2026. “Gold Gains on Fears of Prolonged Middle East Conflict.” Reuters, March 1, 2026. https://www.reuters.com/world/india/gold-rises-1-us-israel-strikes-iran-raise-regional-temperature-2026-03-01/.
Bloomberg. 2019. “How $100 a Barrel Oil Would Affect Global Economy.” The National. The National News. April 29, 2019. https://www.thenationalnews.com/business/energy/how-100-a-barrel-oil-would-affect-global-economy-1.854844.
Business Today Desk. 2025. “Strait of Hormuz on Edge: Why Iran May Threaten Oil Flow but Won’t Risk Shutting It Down.” Business Today. June 14, 2025. https://www.businesstoday.in/world/middle-east/story/strait-of-hormuz-on-edge-why-iran-may-threaten-oil-flow-but-wont-risk-shutting-it-down-480414-2025-06-14.
Chow, Emily, and Jeslyn Lerh. 2026. “Marine Insurers Cancel War Risk Cover, Tanker Costs to Rise as Iran Conflict Intensifies.” Reuters, March 2, 2026. https://www.reuters.com/world/middle-east/ship-insurers-cancel-war-risk-cover-due-iran-conflict-2026-03-02/.
CME Group. 2025. “CME FedWatch Tool – CME Group.” @CMEGroup. 2025. https://www.cmegroup.com/markets/interest-rates/cme-fedwatch-tool.html.
CNBC. 2025. “RBC’s Helima Croft on Eight Key OPEC+ Producers Raising Combined Crude Oil Output.” CNBC. April 3, 2025. https://www.cnbc.com/video/2025/04/03/rbcas-helima-croft-on-eight-key-opec-producers-raising-combined-crude-oil-output.html.
Crooks, Nathan. 2025. “Dallas Fed Energy Survey Says Oil and Gas Production Was Little Changed in Q4.” Reuters, December 17, 2025. https://www.reuters.com/business/energy/dallas-fed-energy-survey-says-oil-gas-production-was-little-changed-q4-2025-12-17/.
Exarheas, Andreas. 2026. “Oil Could Pass $100 as Strait of Hormuz Traffic Halts.” Rigzone.com. rigzone.com. March 2, 2026. https://www.rigzone.com/news/oil_could_pass_100_as_strait_of_hormuz_traffic_halts-02-mar-2026-183099-article.
“Extended Hormuz Closure Could Push Oil toward $110, Analyst Warns.” 2026. Worldoil.com. 2026. https://worldoil.com/news/2026/3/3/extended-hormuz-closure-could-push-oil-toward-110-analyst-warns.
Kumar, Shivendra. 2026. “Iran-Israel War: Up 20% in 2026, Crude Oil Stares at $80 a Barrel.” The Economic Times. Economic Times. February 28, 2026. https://economictimes.indiatimes.com/markets/commodities/news/iran-israel-war-up-20-in-2026-crude-oil-stares-at-80-a-barrel/articleshow/128884731.cms.
News, AInvest. 2026. “Hyperliquid Oil Perps Surge 5%: Flow Metrics.” AInvest. February 28, 2026. https://www.ainvest.com/news/hyperliquid-oil-perps-surge-5-flow-metrics-2602/.
Olesya Astakhova, Alex Lawler, and Ahmad Ghaddar. 2026. “OPEC+ Agrees Modest Oil Output Boost Even as US War on Iran Disrupts Shipments.” Reuters, March 1, 2026. https://www.reuters.com/business/energy/opec-debates-oil-output-boost-us-war-iran-disrupts-shipments-2026-03-01/.
Reuters Staff. 2026. “Fed Rate-Cut Doubts Rise as Middle East Conflict Drives up Energy Prices.” Reuters, March 3, 2026. https://www.reuters.com/business/fed-rate-cut-doubts-rise-middle-east-conflict-drives-up-energy-prices-2026-03-03/.
Shan, Lee Ying. 2026. “$100 Oil? Prolonged Hormuz Closure Could Spark a 1970s-Style Energy Shock.” CNBC. March 2026. https://www.cnbc.com/2026/03/01/experts-weigh-potential-scenarios-for-oil-if-strait-of-hormuz-closes.html.
Stewart, Heather. 2026. “Middle East Crisis Pushes up Oil Prices – and Could Drive Inflation Rises Too.” The Guardian. The Guardian. March 2, 2026. https://www.theguardian.com/business/2026/mar/02/middle-east-crisis-oil-prices-inflation-us-iran-interest-rates-growth.
Team, EBM ADMIN. 2026. “Could War in Iran Trigger a Global Recession? The $100 Oil Scenario Explained.” European Business Magazine. March 2026. https://europeanbusinessmagazine.com/business/could-war-in-iran-trigger-a-global-recession-the-100-oil-scenario-explained/?amp=1.


Related Articles

The Implications of the April 2026 U.S.–Iran Ceasefire on Oil Prices

Defence Economies at War: National Budget Stress

Blank Rounds: Can Trump Blockade the Strait of Hormuz?

Breaking the Tether: How Iridium Unleashes Shahed Drones

Pulse: The United States-Israel-Iran War
Comments